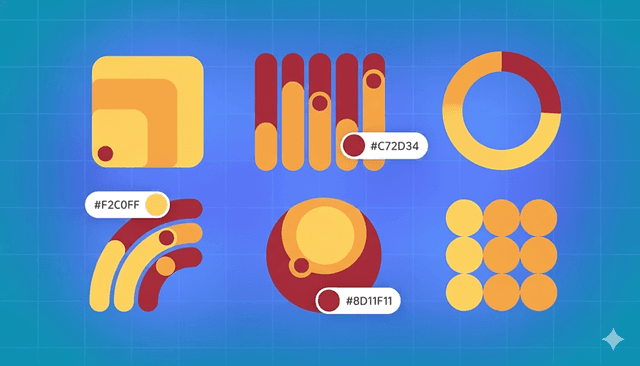
Infographics are everywhere. They take complex ideas and transform them into visually engaging, easy-to-understand content. But one key question often arises: how do you select colors that communicate clearly while capturing your audience’s attention?
In this guide, we’ll cover color theory basics, how color influences perception, tips for picking the ideal palette, and nine inspiring color combinations to elevate your infographic designs.
Discover Colors with the Palettt Tool
Give your designs a bold, vibrant edge with the Palettt color palette generator. Experiment with shades that make infographics, social media visuals, and presentations pop. No guesswork—just choose colors and build the perfect palette.
9 Infographic Color Palettes for Engagement
Striking the right balance between creativity and readability is crucial in infographic design. Here are nine color palettes, each slightly adjusted for a fresh twist, suited for different themes and moods:
01. Autumn Glow
- Maroon: HEX #800000, RGB (128, 0, 0)
- Turkish Rose: HEX #B76C79, RGB (183, 108, 121)
- Burnt orange: HEX #CC5500, RGB (204, 85, 0)
- Lightning Yellow: HEX #FFBF33, RGB (255, 191, 51)
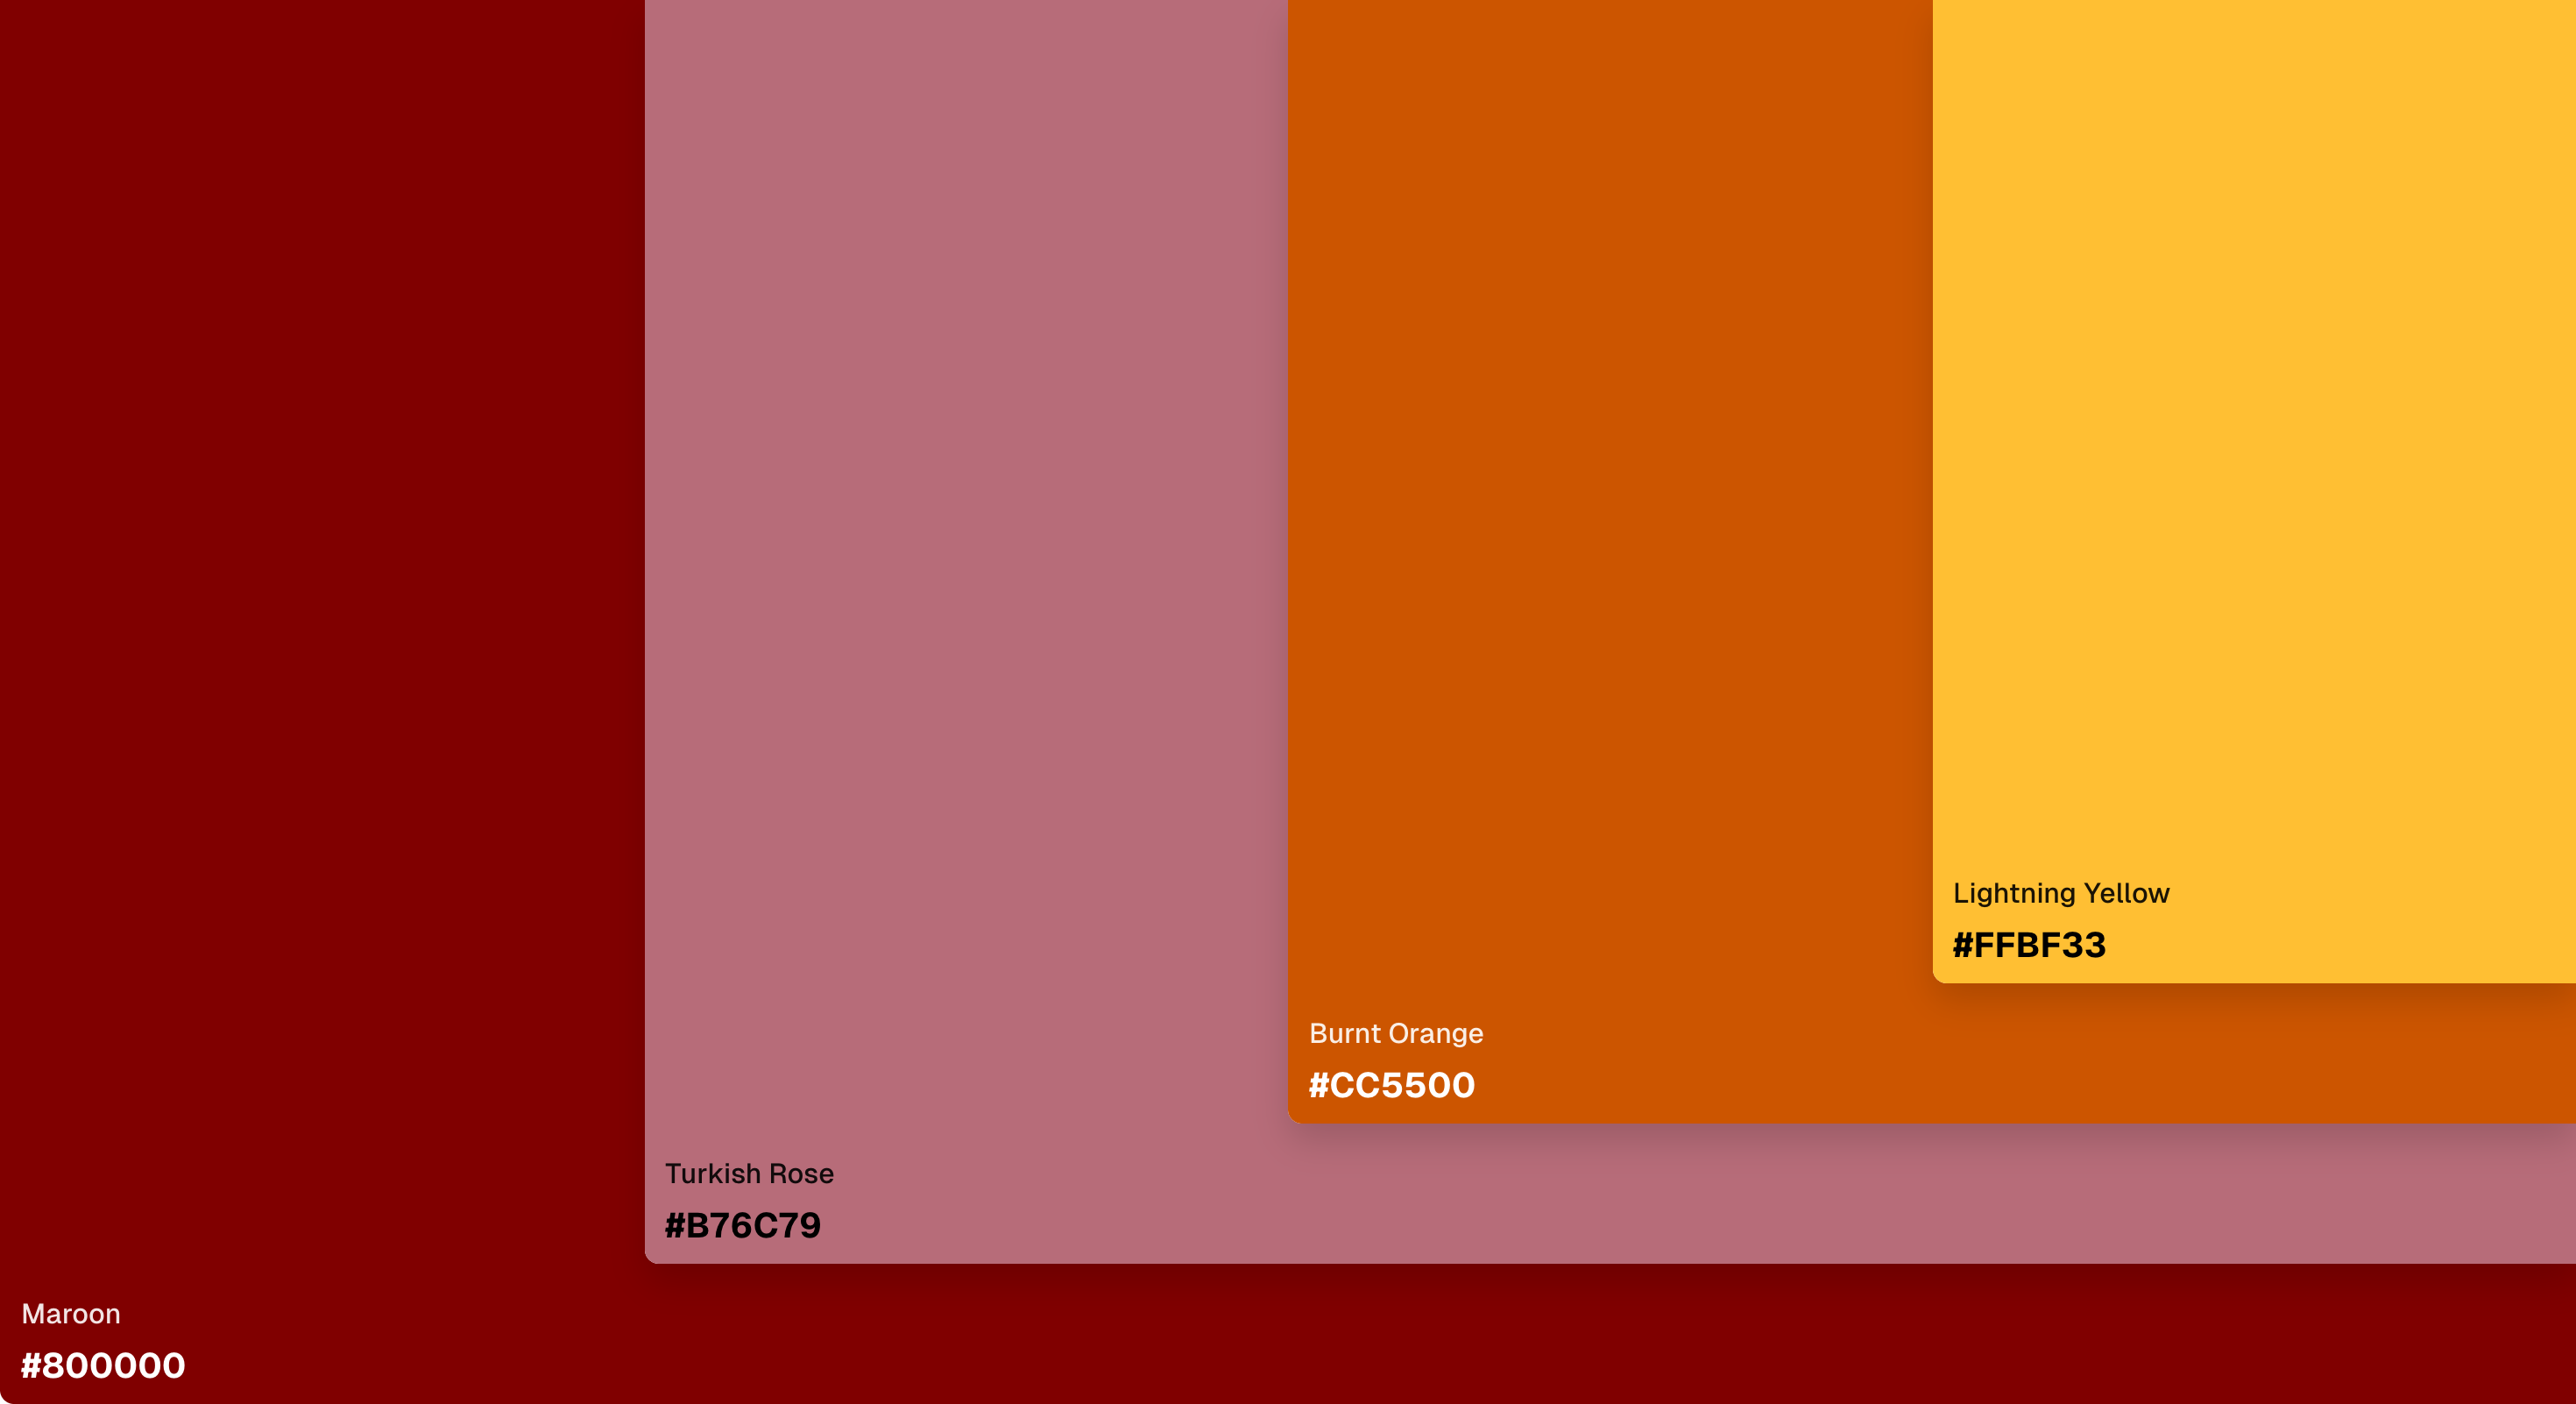
A warm and inviting palette perfect for fall-themed infographics.
02. Bold & Modern
- Navy Blue: HEX #000080, RGB (0, 0, 128)
- Lochinvar: HEX #009999, RGB (0, 153, 153)
- Limed Spruce: HEX #36454F, RGB (54, 69, 79)
- Golden Fizz: HEX #FFFF33, RGB (255, 255, 51)
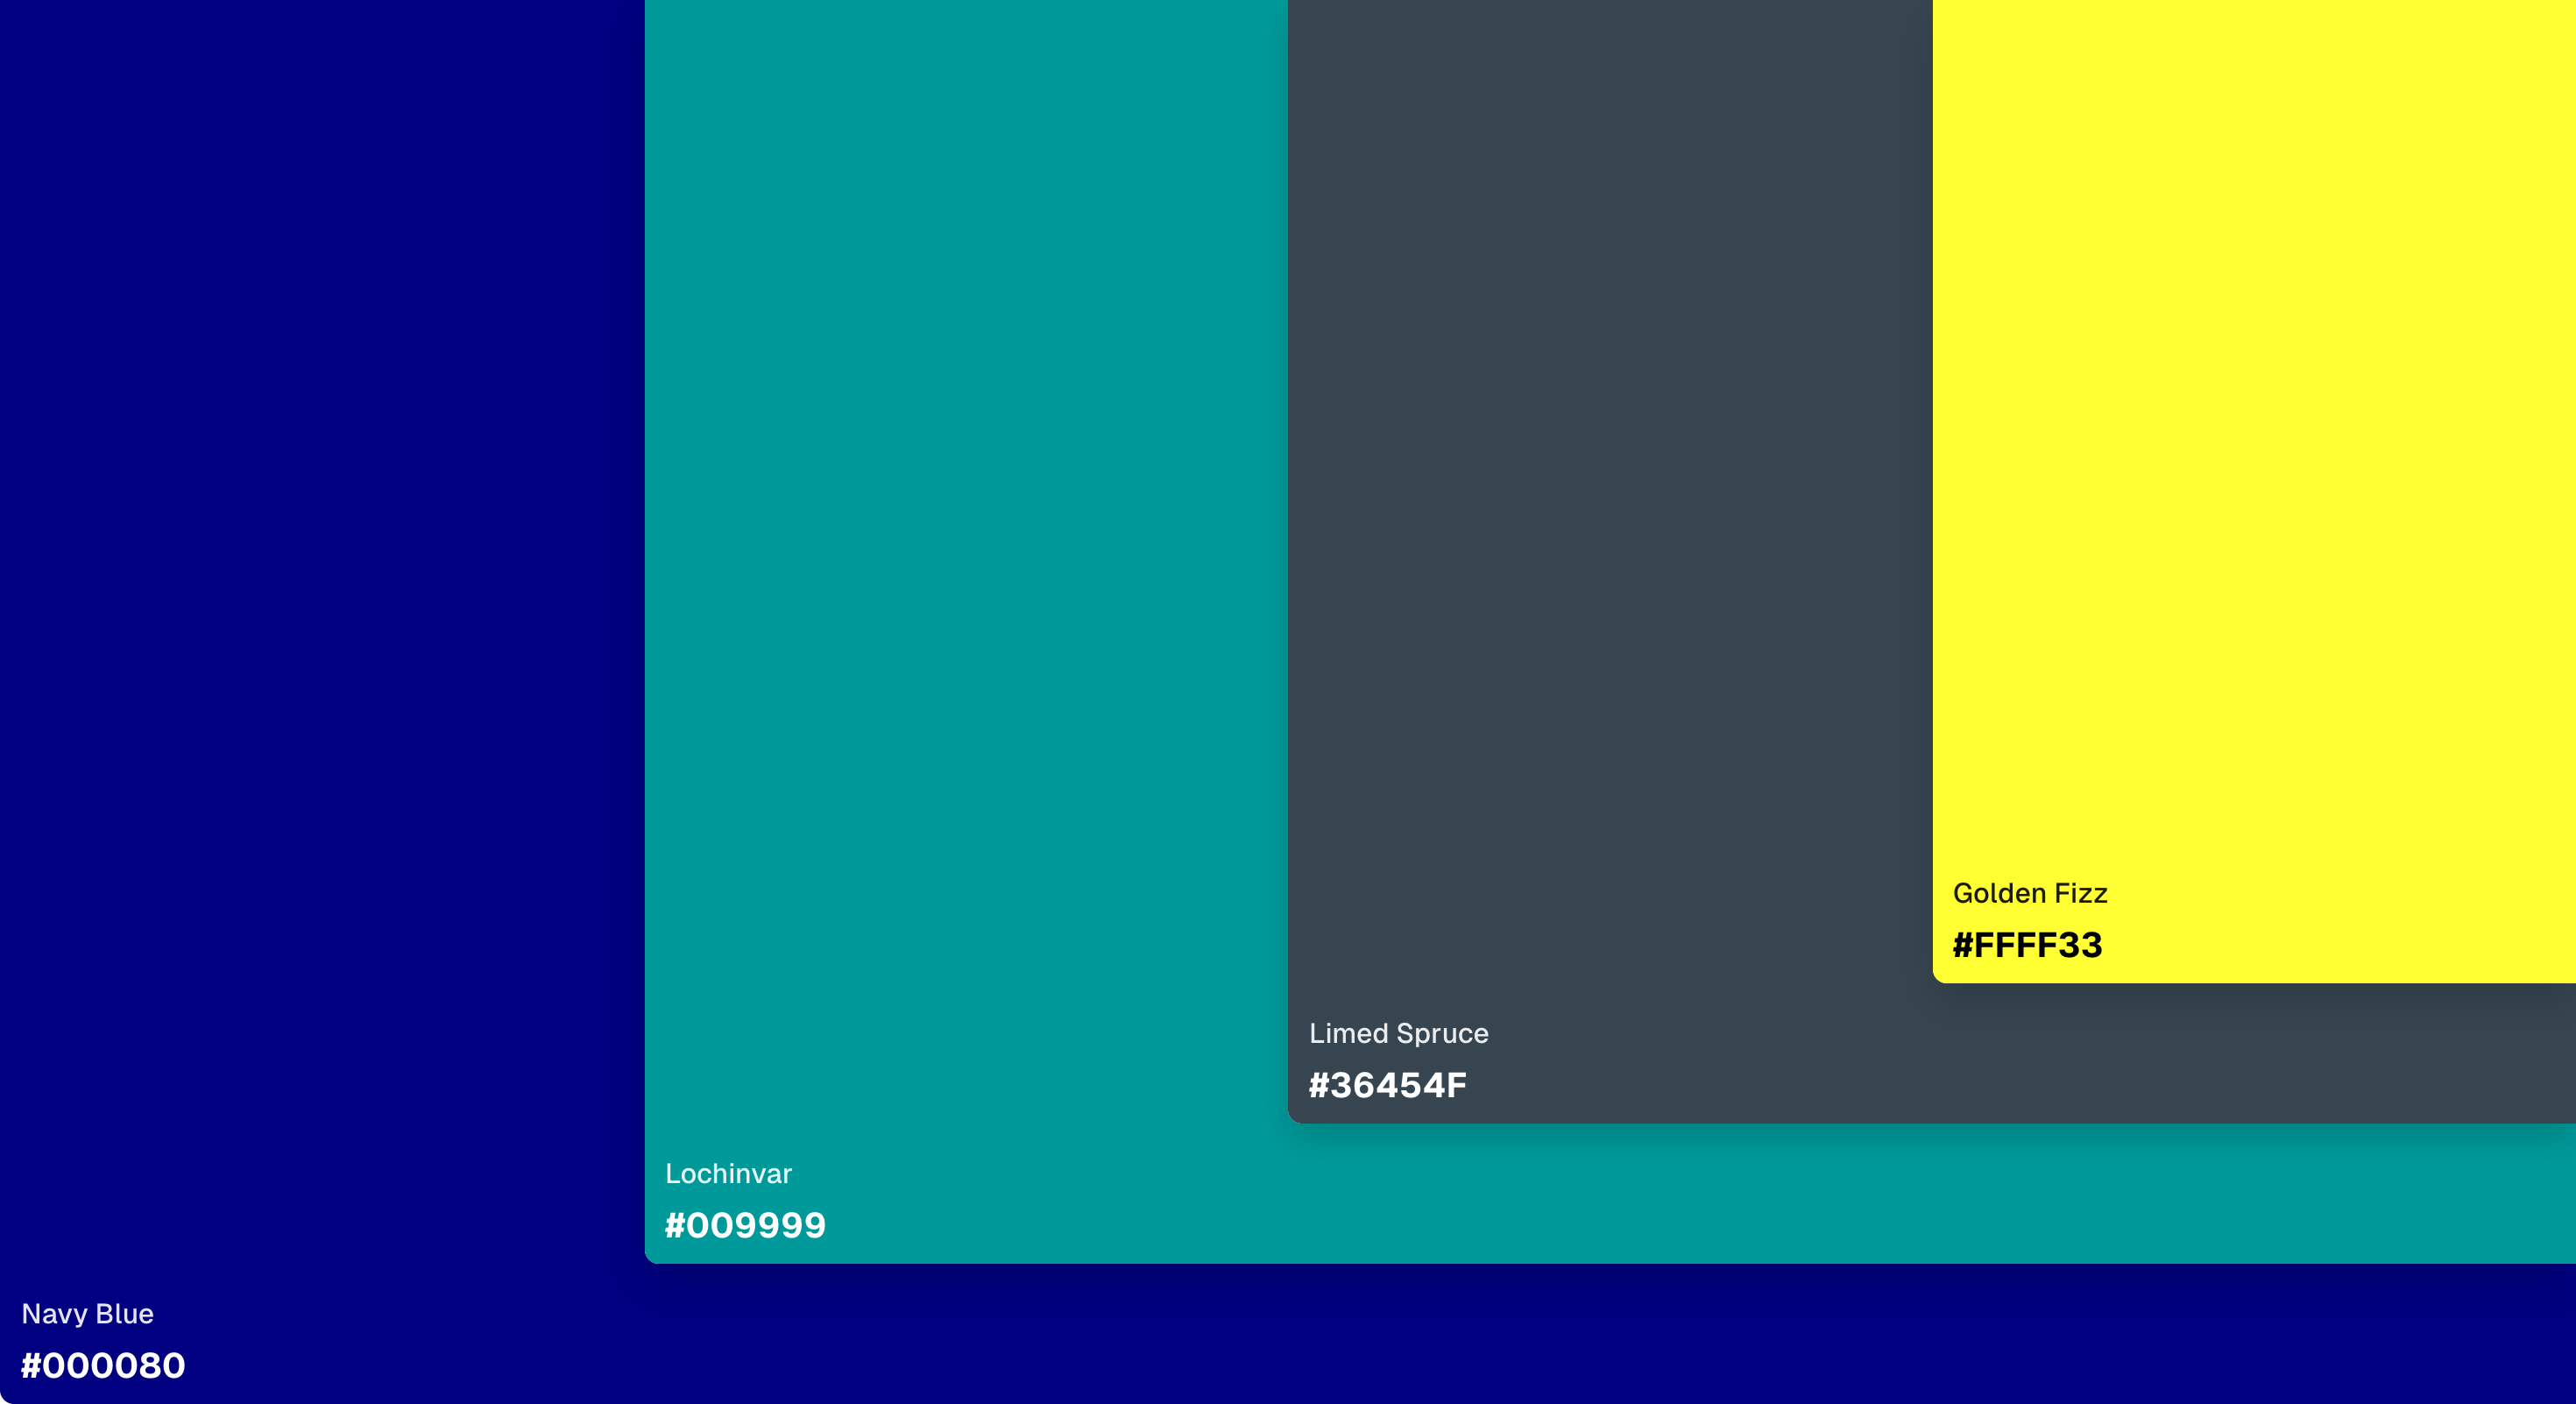
Vibrant yet professional, perfect for high-impact visuals.
03. Coastal Calm
- Alge Green: HEX #92EABF, RGB (146, 234, 191)
- Regent St Blue: HEX #ADD8E6, RGB (173, 216, 230)
- Aqua: HEX #00FFFF, RGB (0, 255, 255)
- Chino: HEX #D8C9A5, RGB (216, 201, 165)
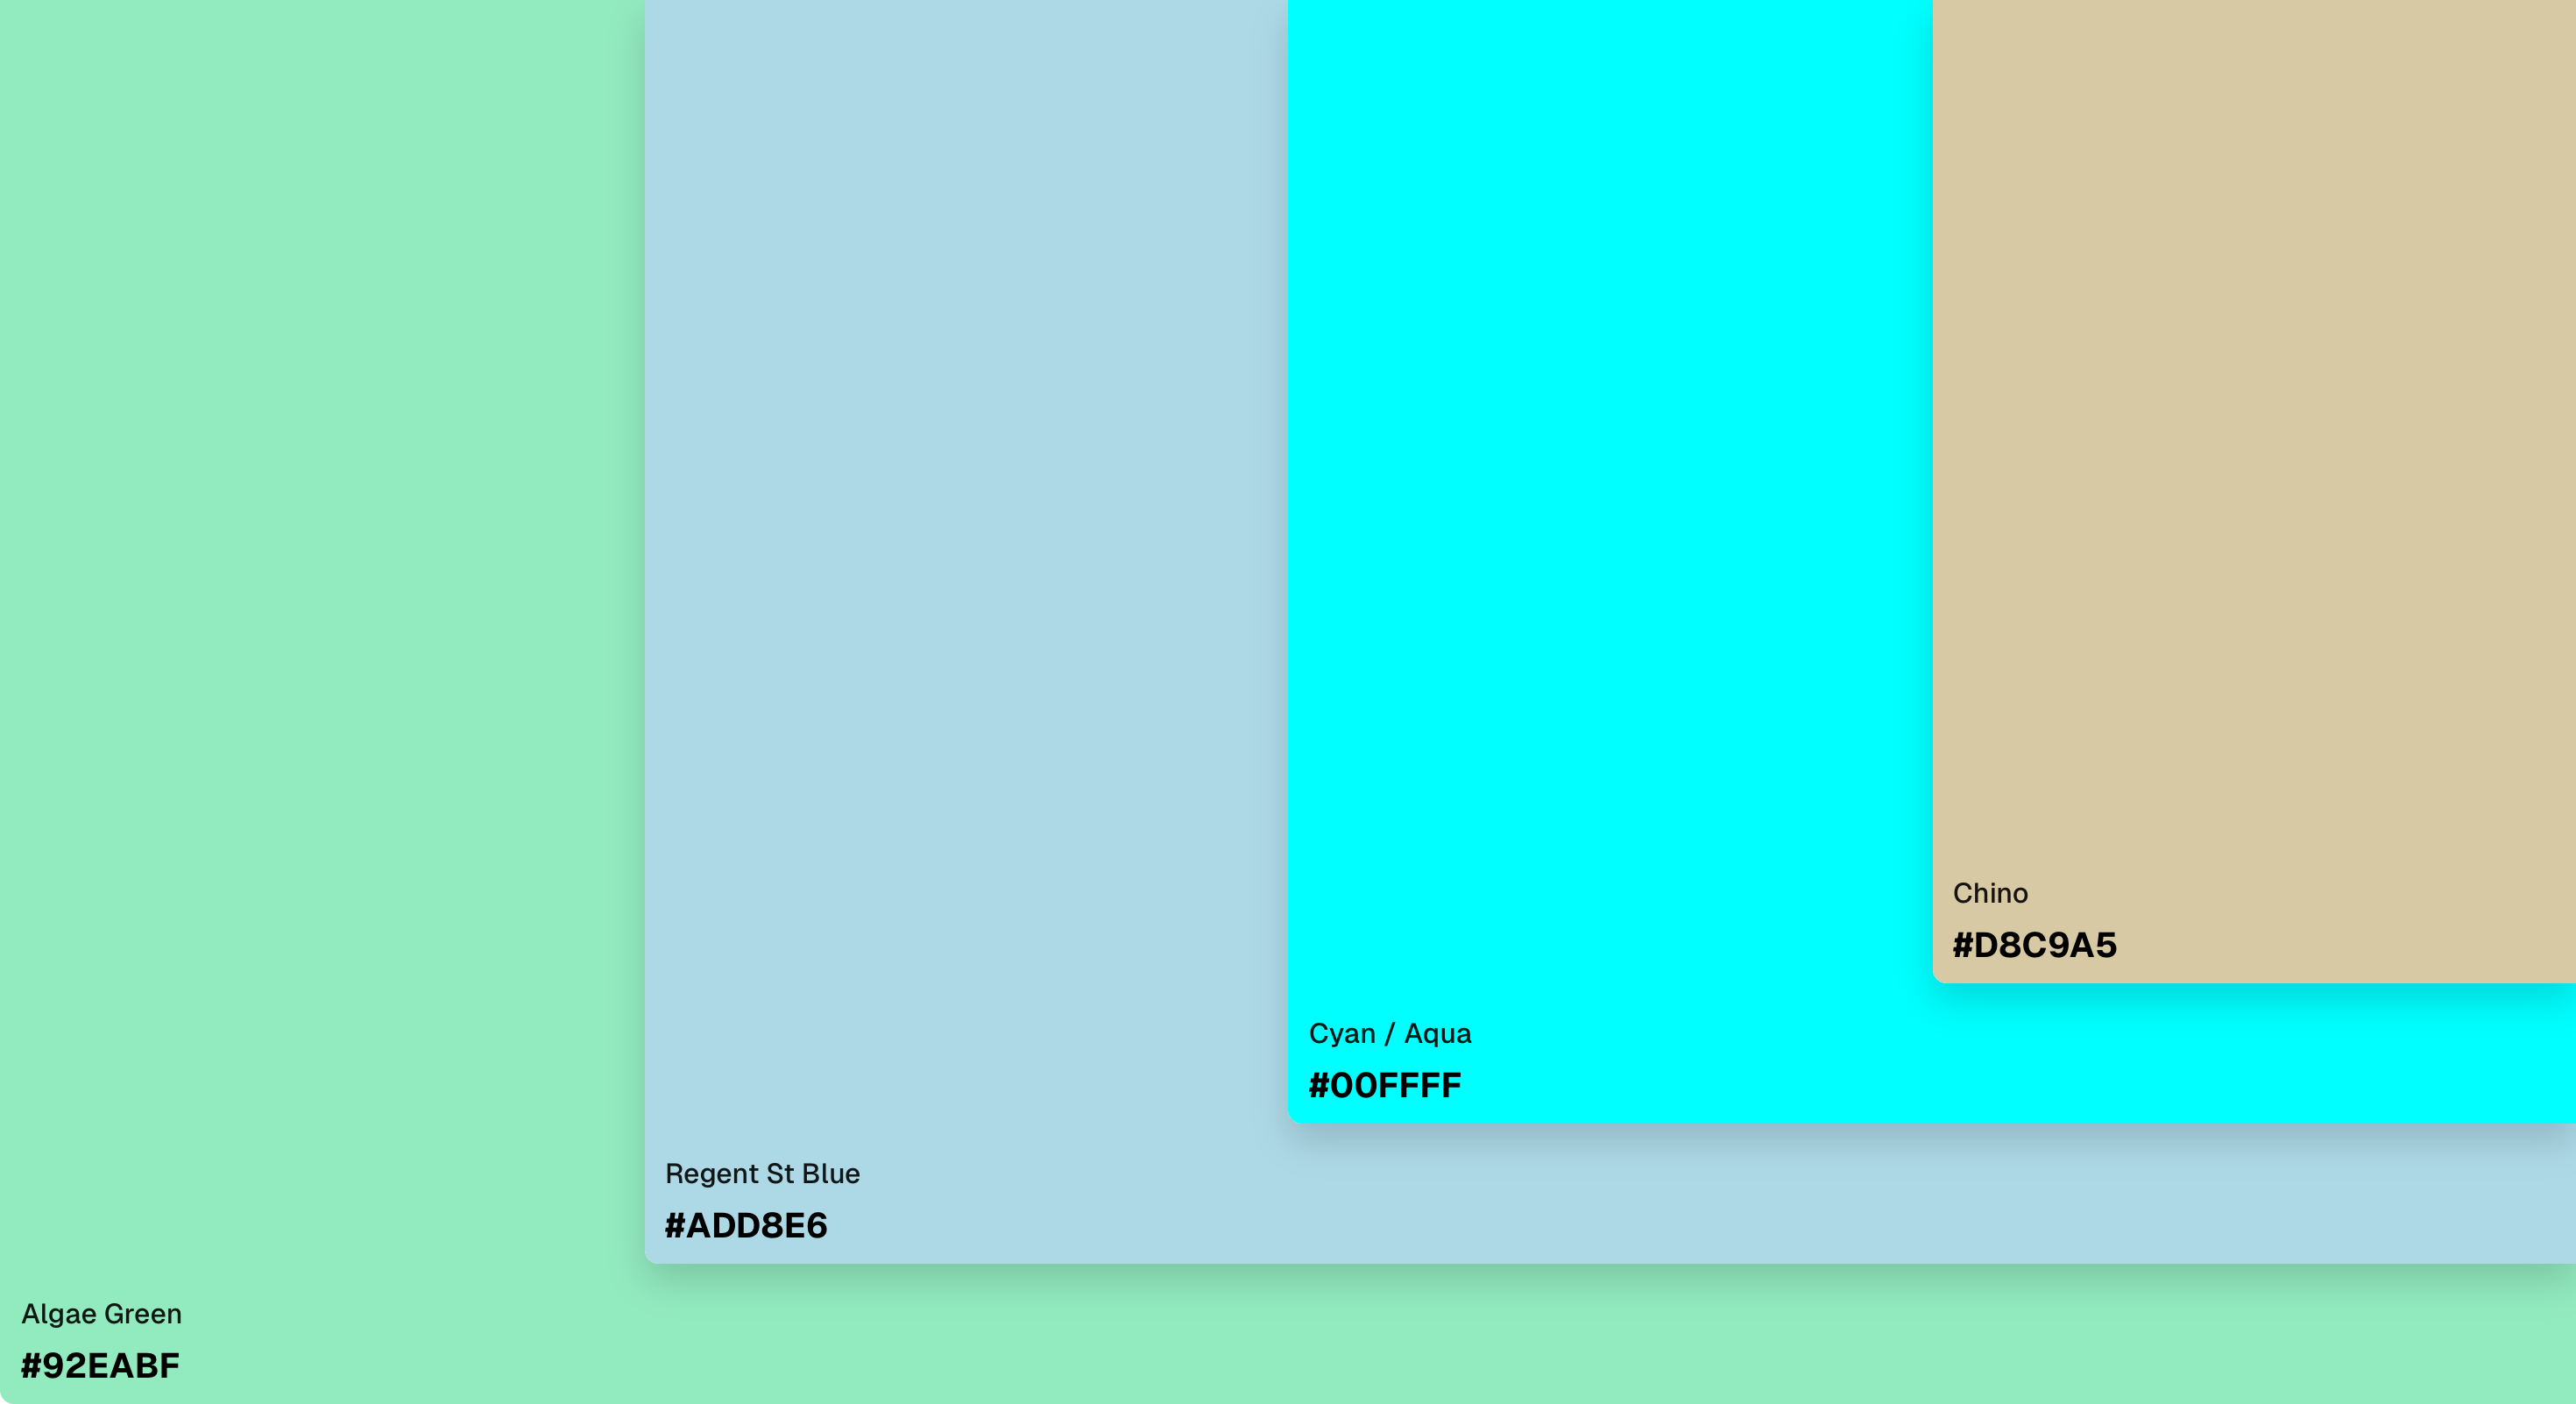
A soothing palette ideal for nature, travel, or wellness topics.
04. Forest Retreat
- Forest green: HEX #228B22, RGB (34, 139, 34)
- Sage: HEX #9C9F86, RGB (156, 159, 134)
- Olive: HEX #808000, RGB (128, 128, 0)
- Hot Cinnamon: HEX #D2691E, RGB (210, 105, 30)
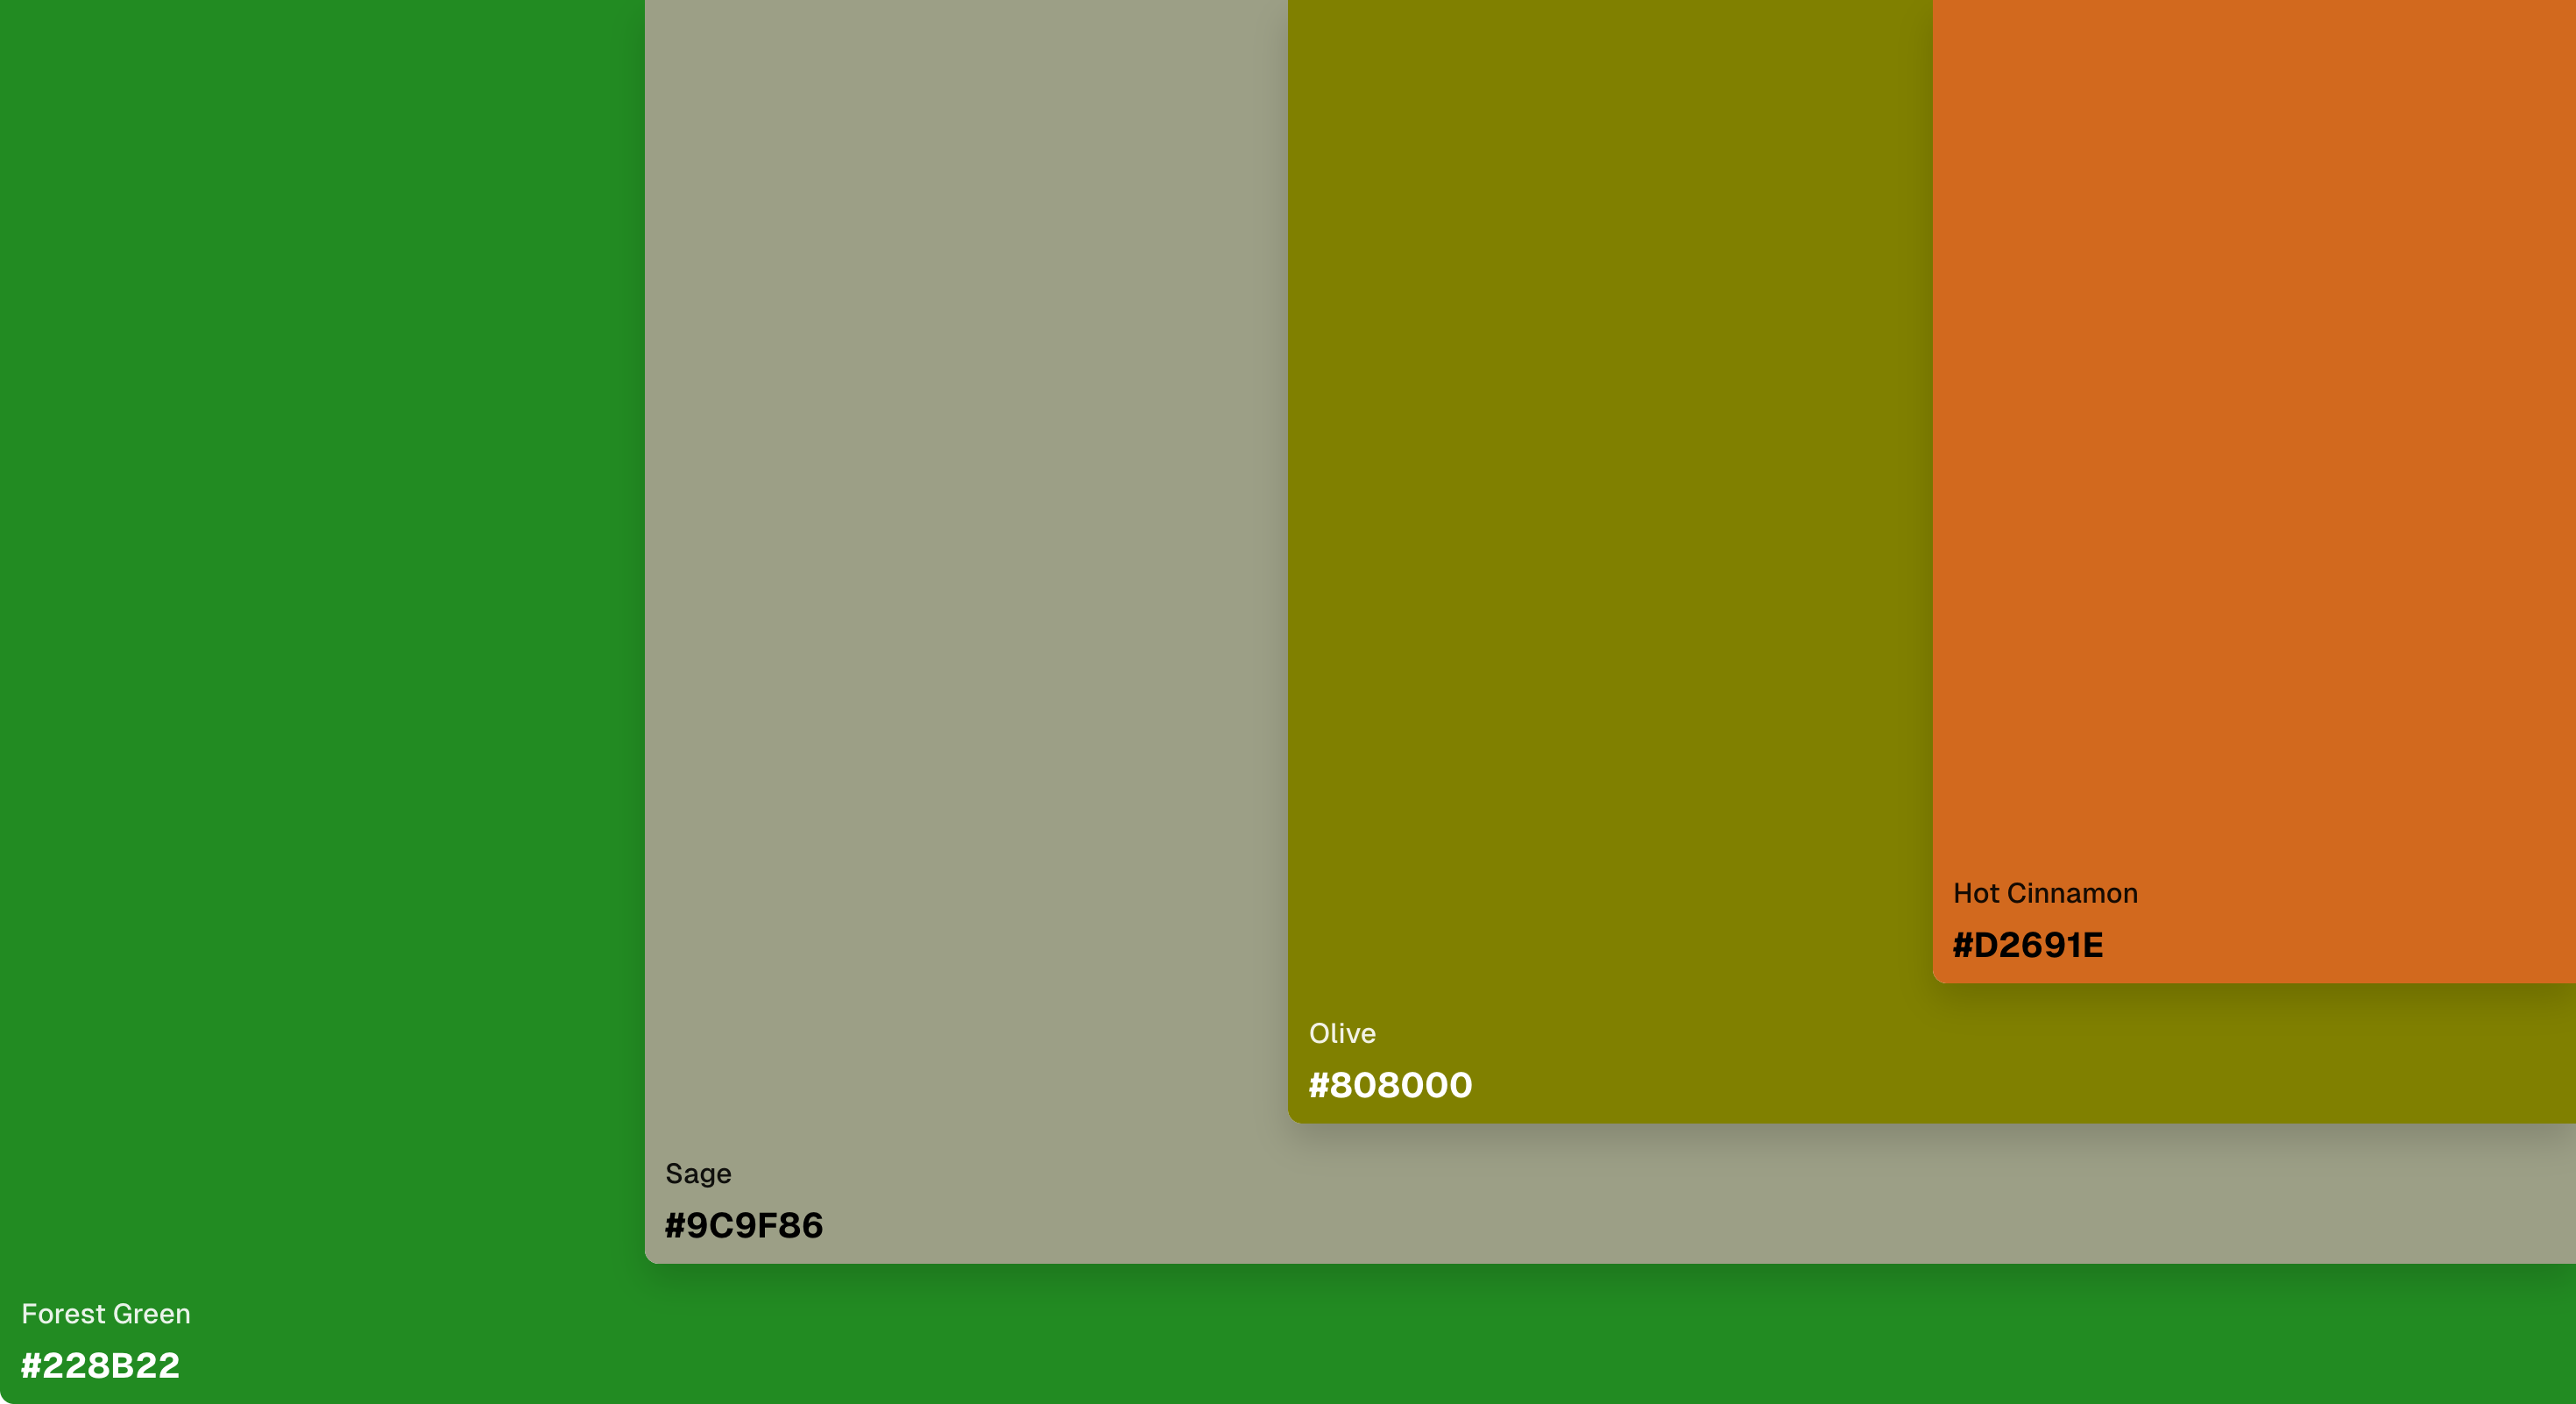
Rich greens paired with earthy tones for a natural and grounded feel.
05. Minimal Contrast
- Mine Shaft: HEX #343434, RGB (52, 52, 52)
- Grey: HEX #808080, RGB (128, 128, 128)
- Silver: HEX #C0C0C0, RGB (192, 192, 192)
- Desert Storm: HEX #FAF9F6, RGB (250, 249, 246)
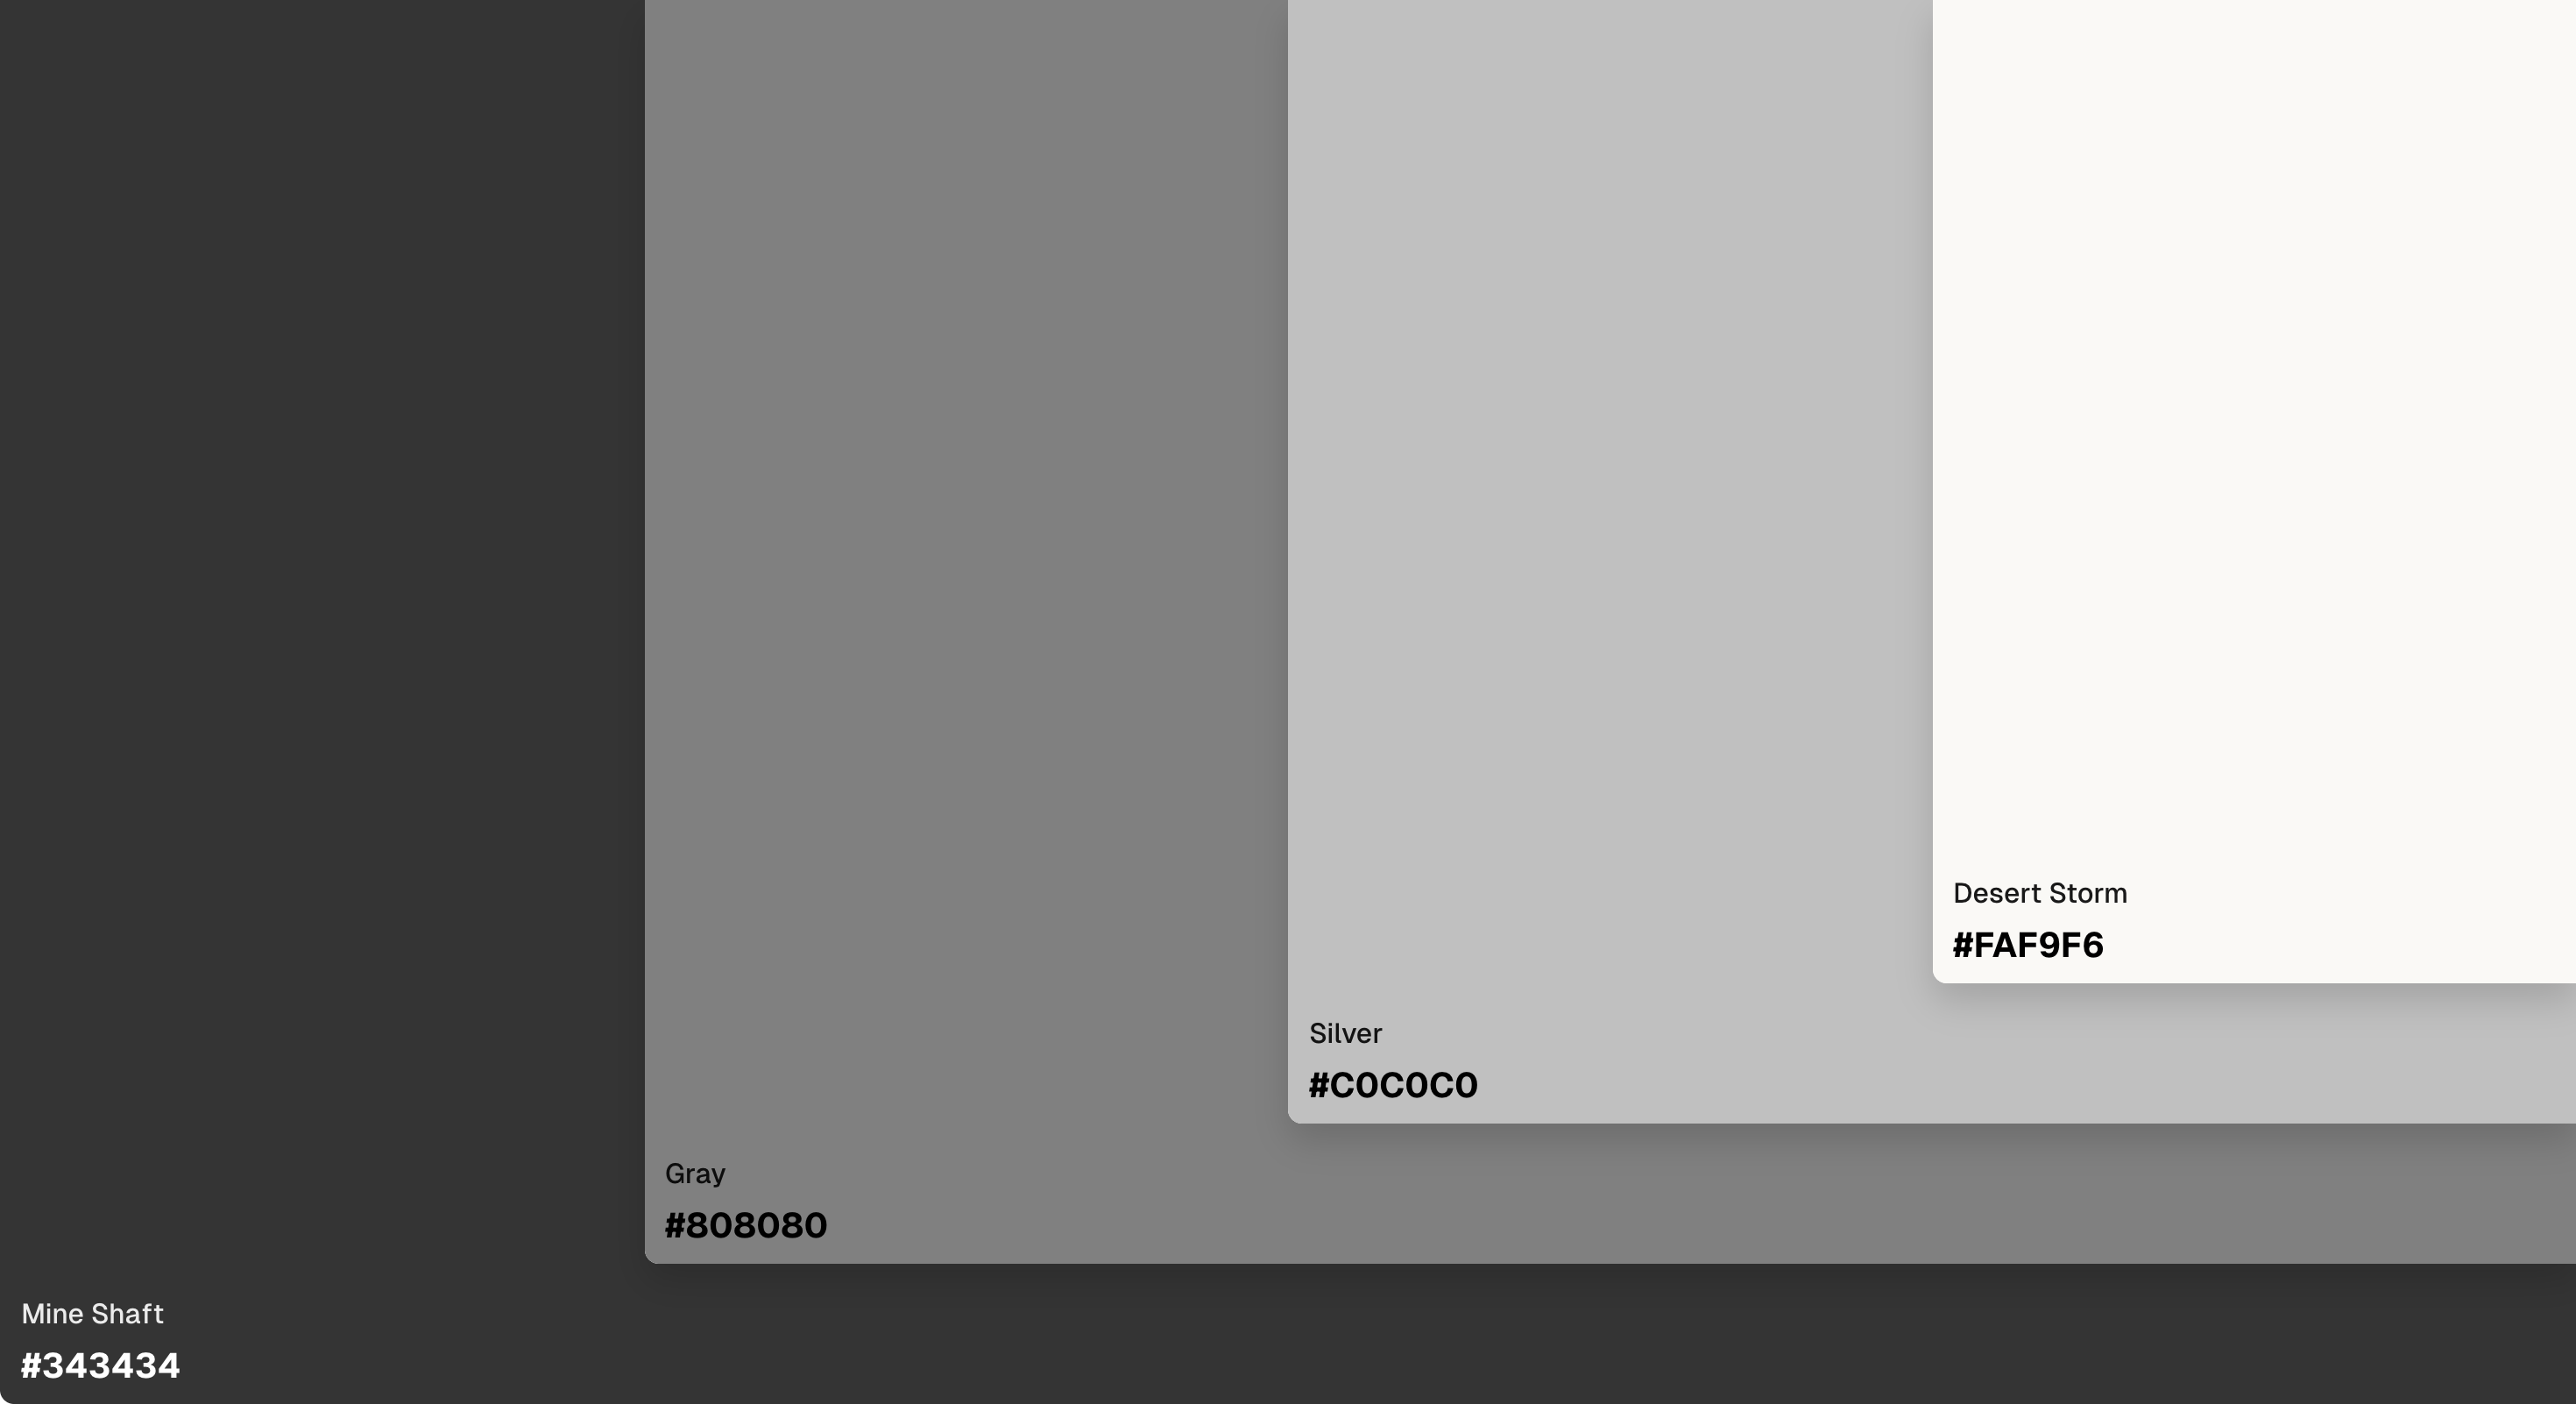
Clean, simple, and professional—great for corporate or tech topics.
06. Playful Pop
- Hot pink: HEX #FF68B4, RGB (255, 104, 180)
- Spray: HEX #7DF9FF, RGB (125, 249, 255)
- Golden Fizz: HEX #FFFF33, RGB (255, 255, 51)
- Magenta: HEX #FF00FF, RGB (255, 0, 255)
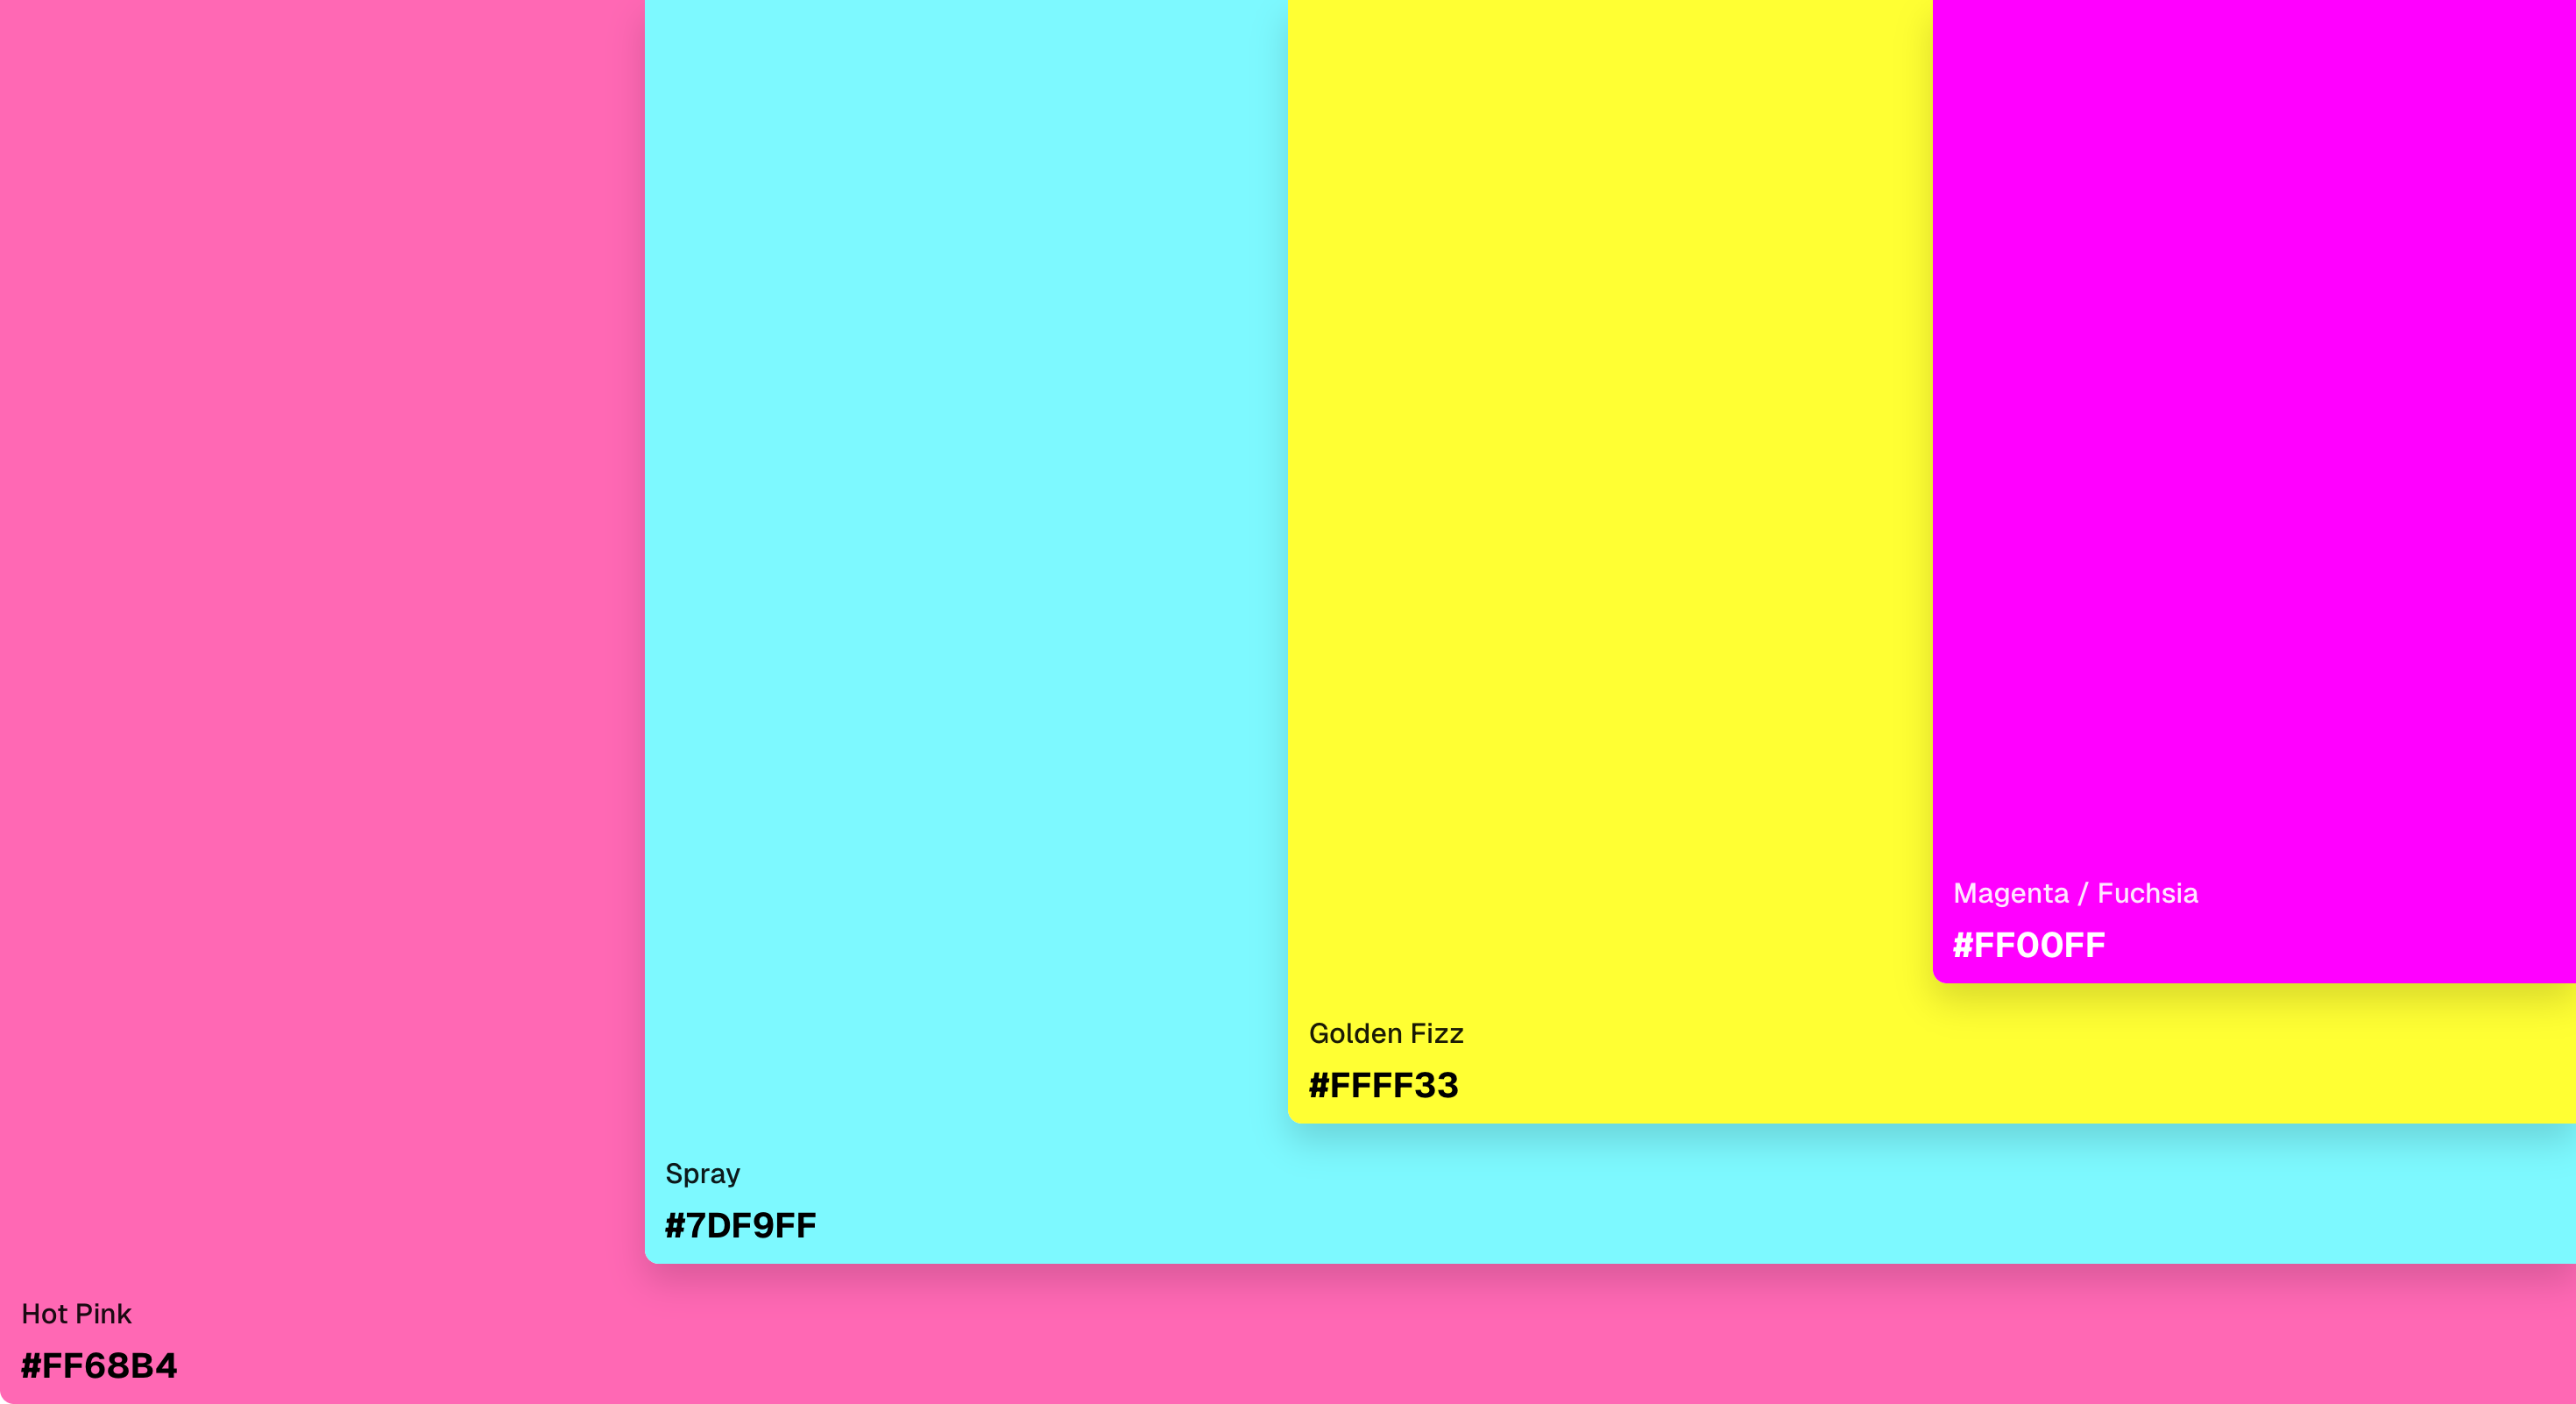
Fun and energetic, perfect for youth-focused or creative infographics.
07. Royal Elegance
- Monarch: HEX #800020, RGB (128, 0, 32)
- Gold: HEX #FFD700, RGB (255, 215, 0)
- Royal blue: HEX #4169E1, RGB (65, 105, 225)
- Ivory: HEX #FFFFF0, RGB (255, 255, 240)
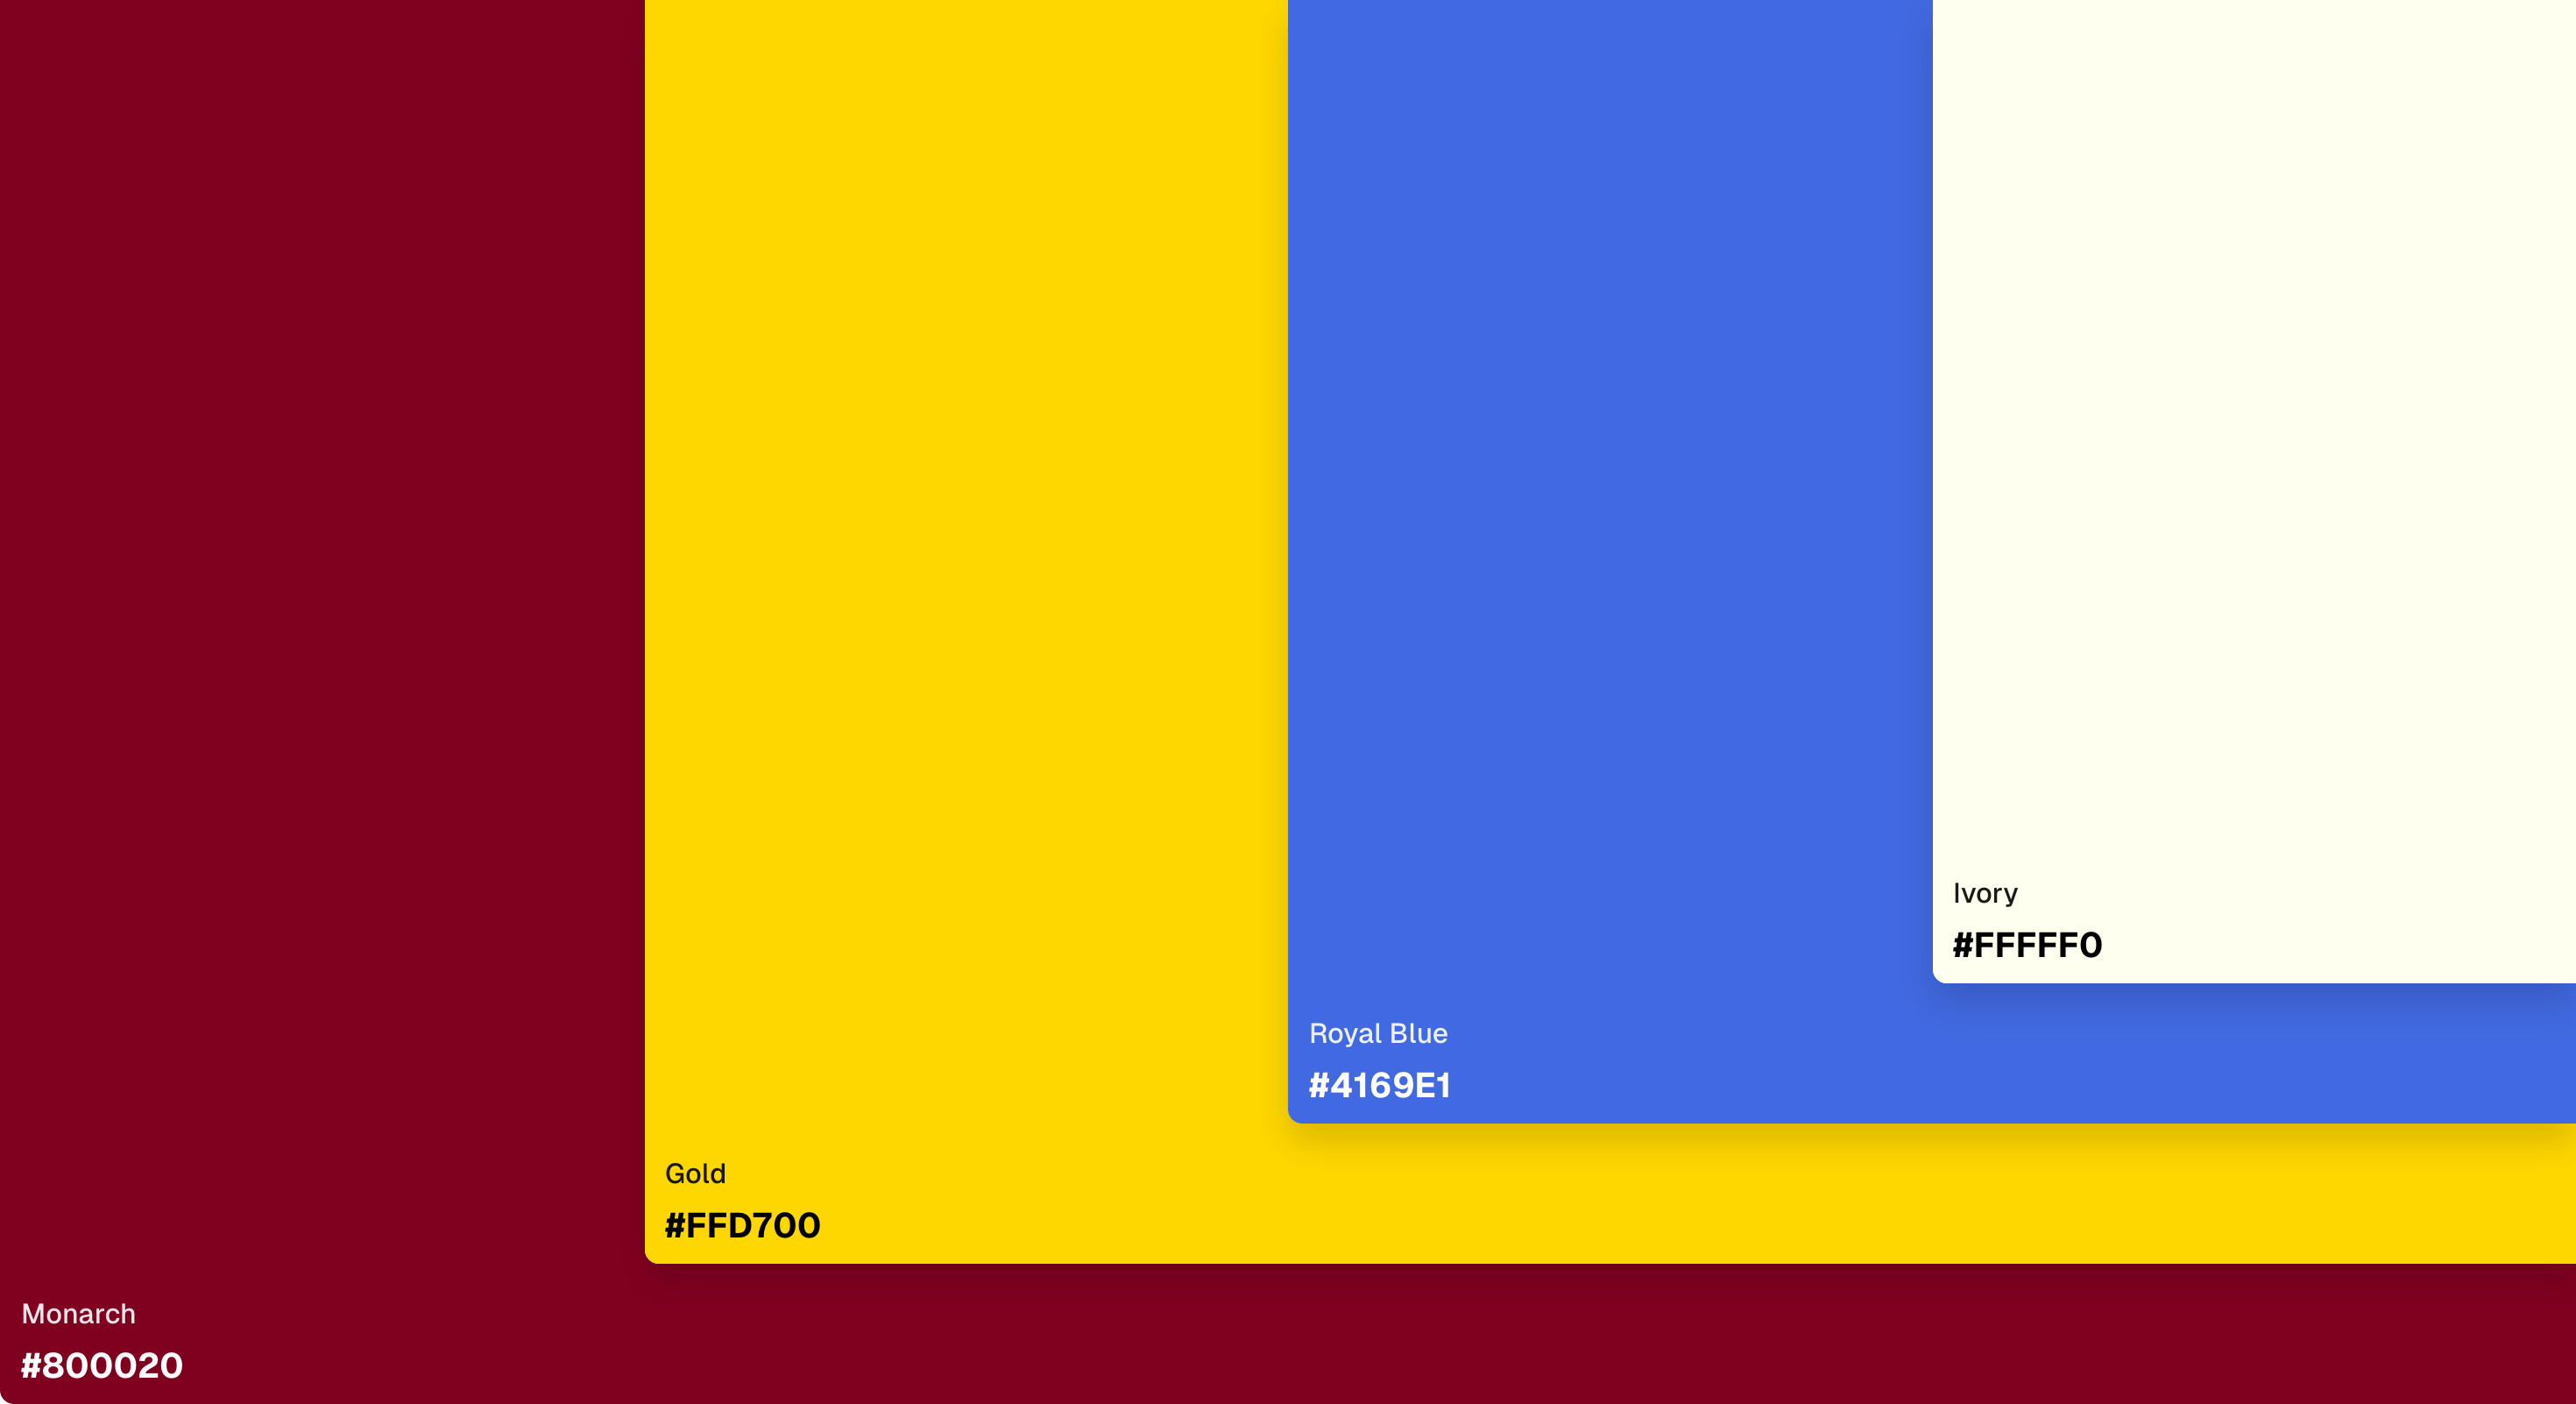
Luxurious and classic—ideal for formal or premium content.
08. Soft Pastels
- Pastel green: HEX #78DD78, RGB (120, 221, 120)
- Periwinkle: HEX #CCCCFF, RGB (204, 204, 255)
- Titan White: HEX #E6E6FA, RGB (230, 230, 250)
- Peach: HEX #FFE6B4, RGB (255, 230, 180)
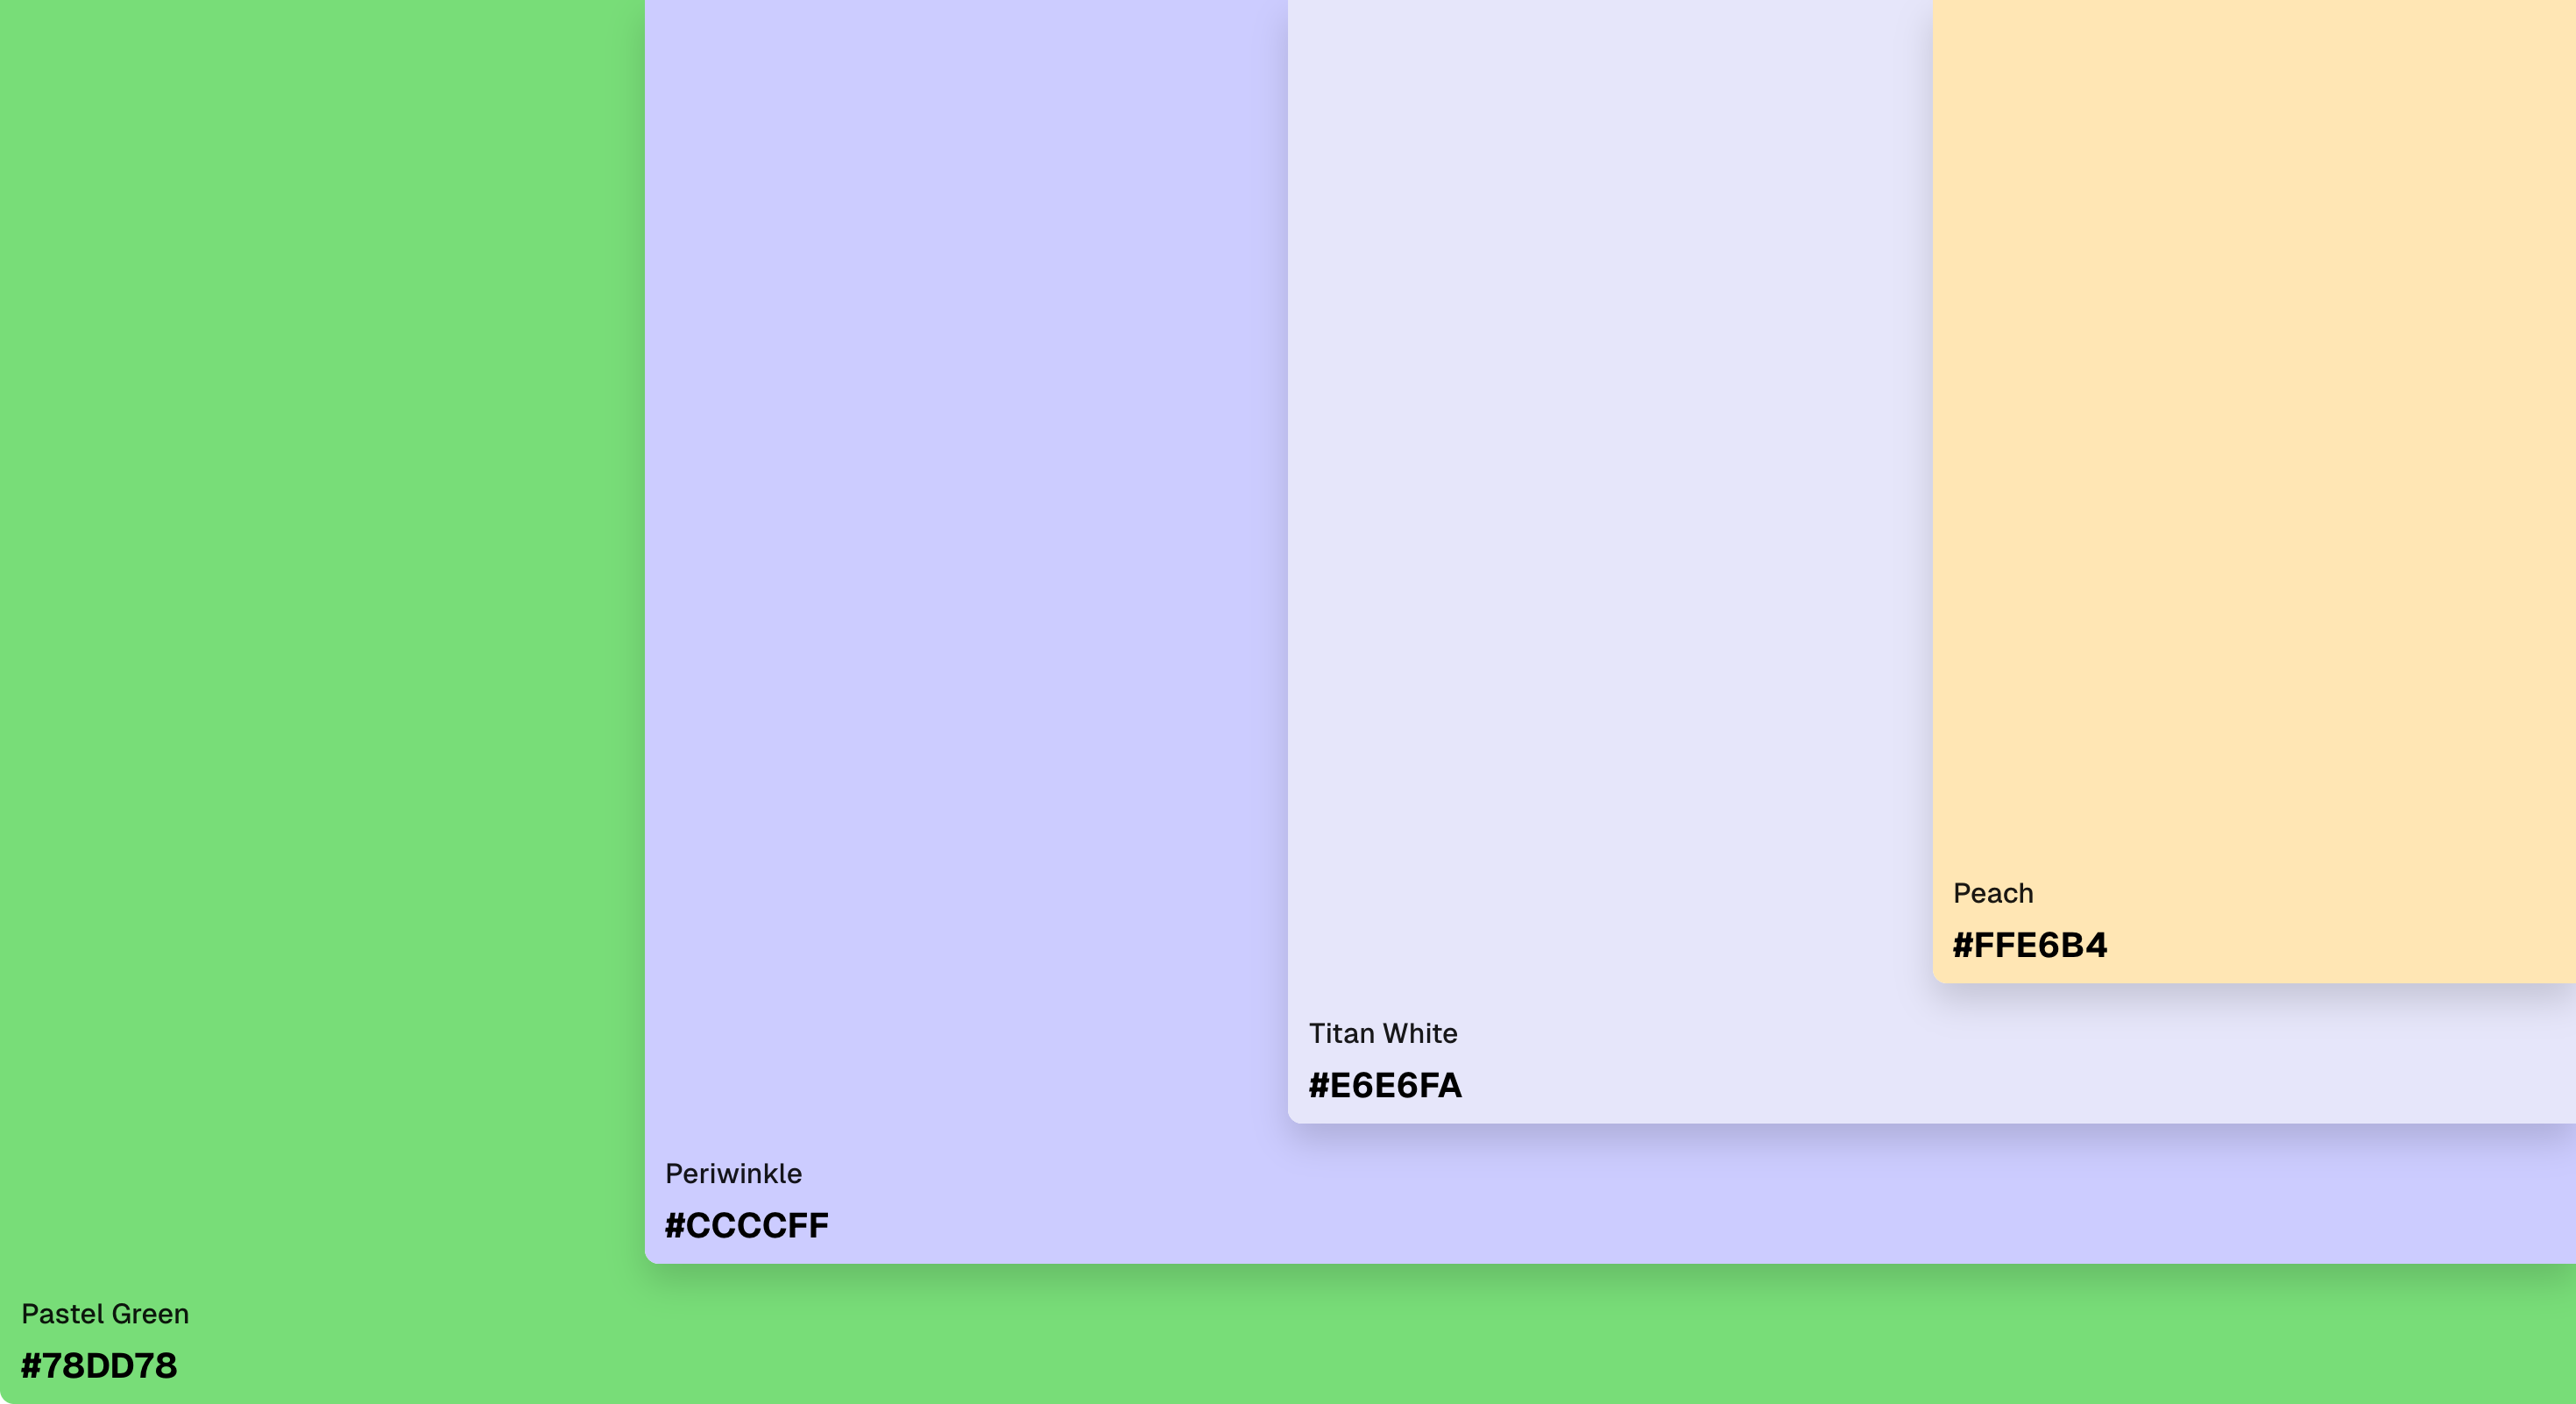
Gentle and calming, perfect for wellness, lifestyle, or education content.
09. Sunset Glow
- Blaze Orange: HEX #FF6600, RGB (255, 102, 0)
- Coral: HEX #FF7F50, RGB (255, 127, 80)
- Gold: HEX #FFD700, RGB (255, 215, 0)
- Cream: HEX #FFFDD0, RGB (255, 253, 208)
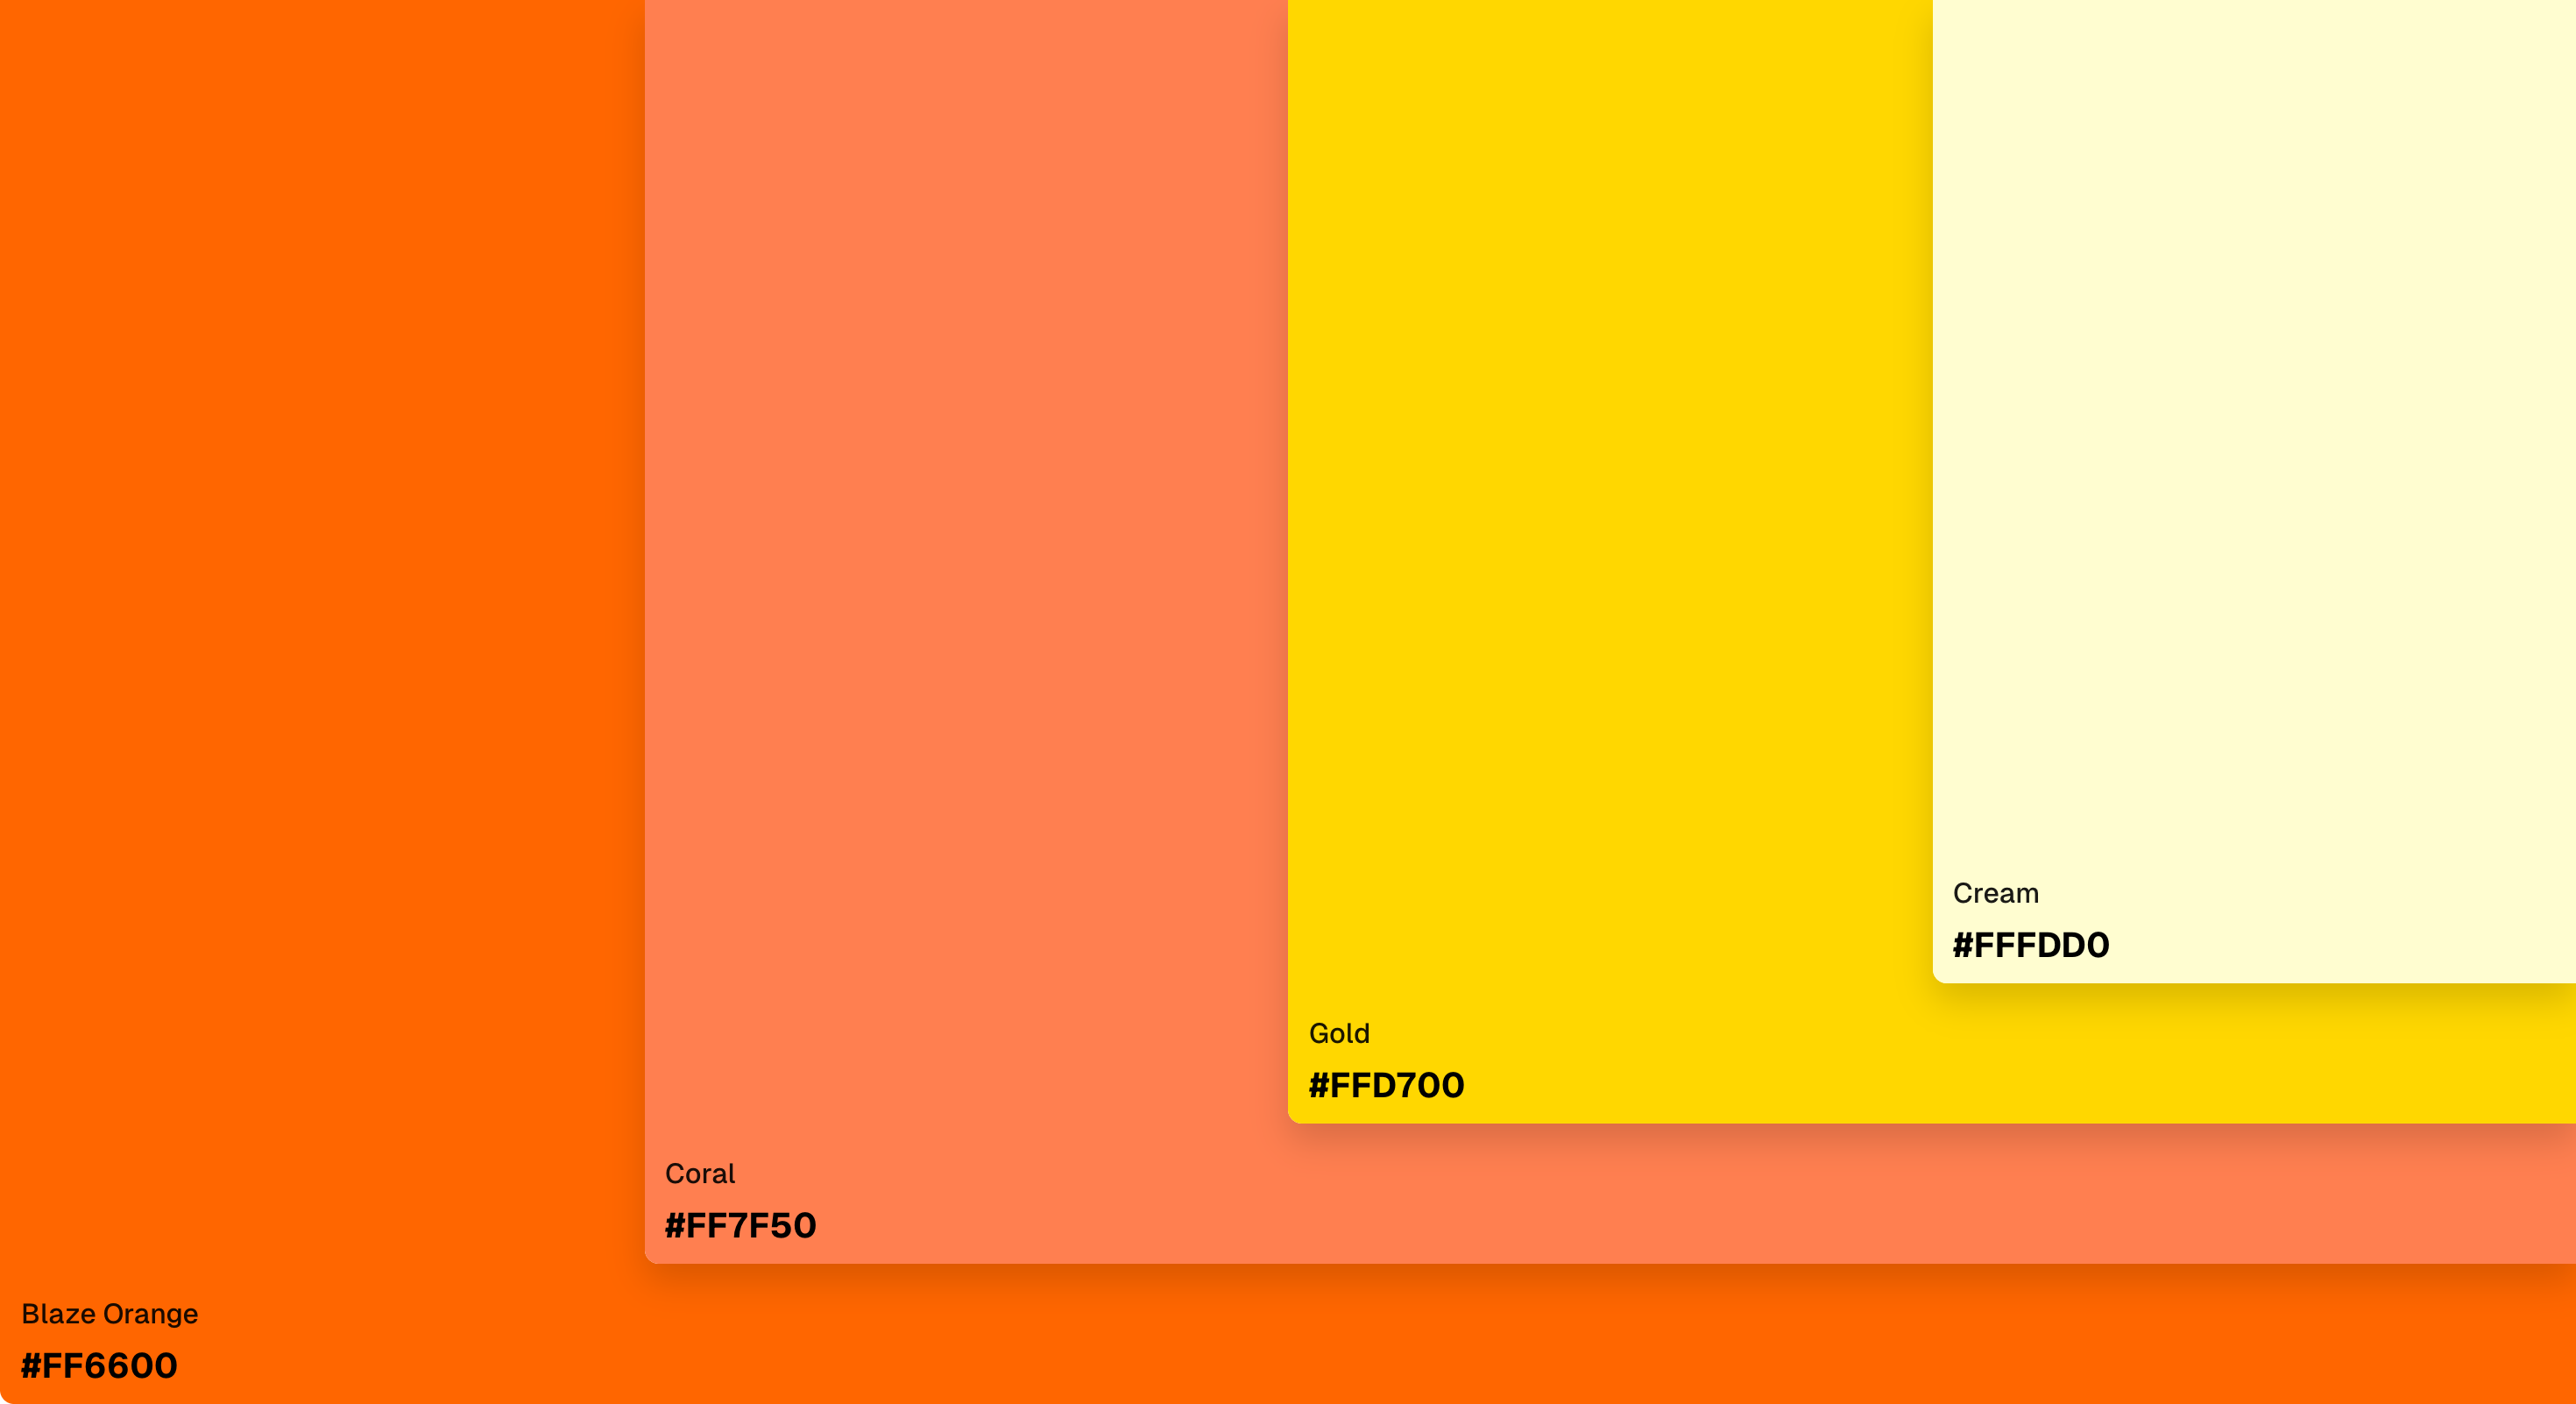
Warm, vibrant, and attention-grabbing—great for lifestyle or travel content.
Color Theory Basics for Infographics
Color theory is more than “red means stop.” It explains why certain colors work well together and how they affect emotions. Primary colors—red, yellow, blue—combine to create secondary colors like orange, green, and purple. Tints, shades, and tones expand your palette further.
Relationships on the color wheel guide harmonious designs:
- Complementary: Opposite colors (e.g., blue & orange) for high contrast.
- Analogous: Neighboring colors (e.g., green, blue-green, blue) for harmony.
- Triadic: Three evenly spaced colors (e.g., red, yellow, blue) for balance and vibrancy.
How Color Impacts Infographics
Colors communicate meaning and guide the viewer’s eye. Warm colors like red and orange evoke energy or urgency, while cool colors like blue and green promote calm and trust. Proper contrast ensures readability for all users, including those with color vision differences.
Tips for Choosing and Using Infographic Colors
- Consider your audience: Tailor colors to demographics and context.
- Start with the message: Align palette with your infographic’s story.
- Think about readability: Use 3–5 colors, reserving accent colors for emphasis.
- Use on-brand colors: Maintain brand consistency while keeping clarity.
- Apply the 60-30-10 rule: Dominant, secondary, and accent colors for balance.
- Leave space: Negative space prevents visual clutter.
- Highlight key info: Bold or bright colors draw attention to important details.
- Maintain consistency: Use colors consistently to avoid confusing viewers.
Tools like Palettt make creating cohesive palettes easy. Upload images or select a base color and generate multiple complementary schemes for your infographics.